
Trade analysis
Gold Four Hour Chart and Supply Zone Review | 7 August 2026
By Alan Solarsh · 7 August 2026
Alan Solarsh marks a supply zone on gold, checks jobs data and sentiment, then chooses to wait on Friday.
What the chart shows
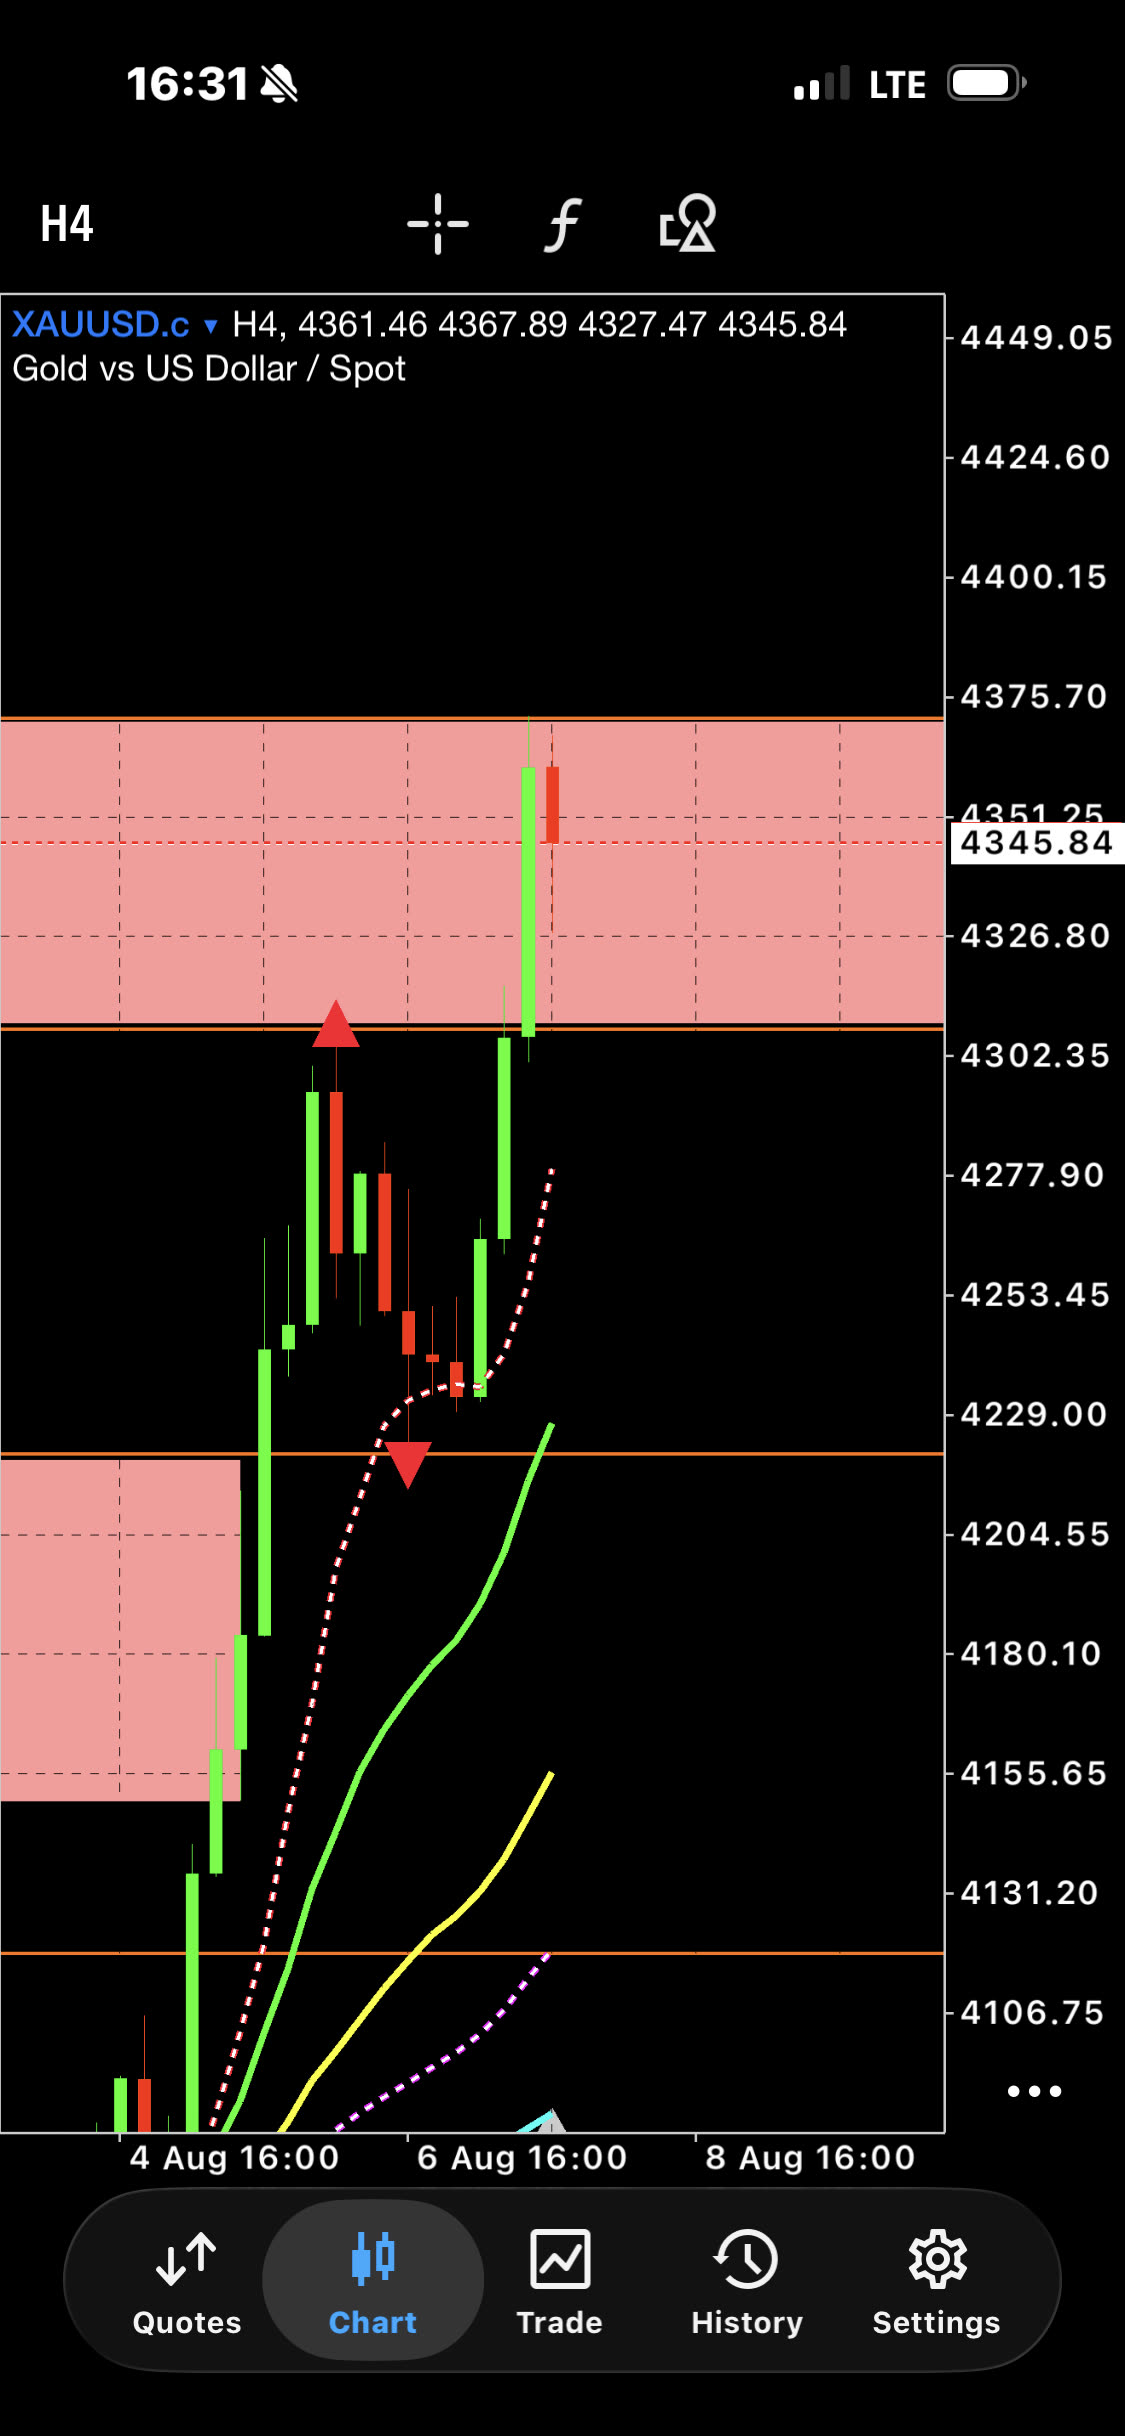
On this four-hour gold chart, price has climbed to a pink supply zone. A supply zone is a price area where sellers have appeared before. Alan says adding buy trades as price enters the zone is too late, so he waits.
Knowing these areas helps you avoid chasing price when time is short. A patient routine fits around a day job and a busy week.
Key points from the video
- Alan points out a fractal and a supply zone on the chart, and says he is not claiming the supply zone will hold.
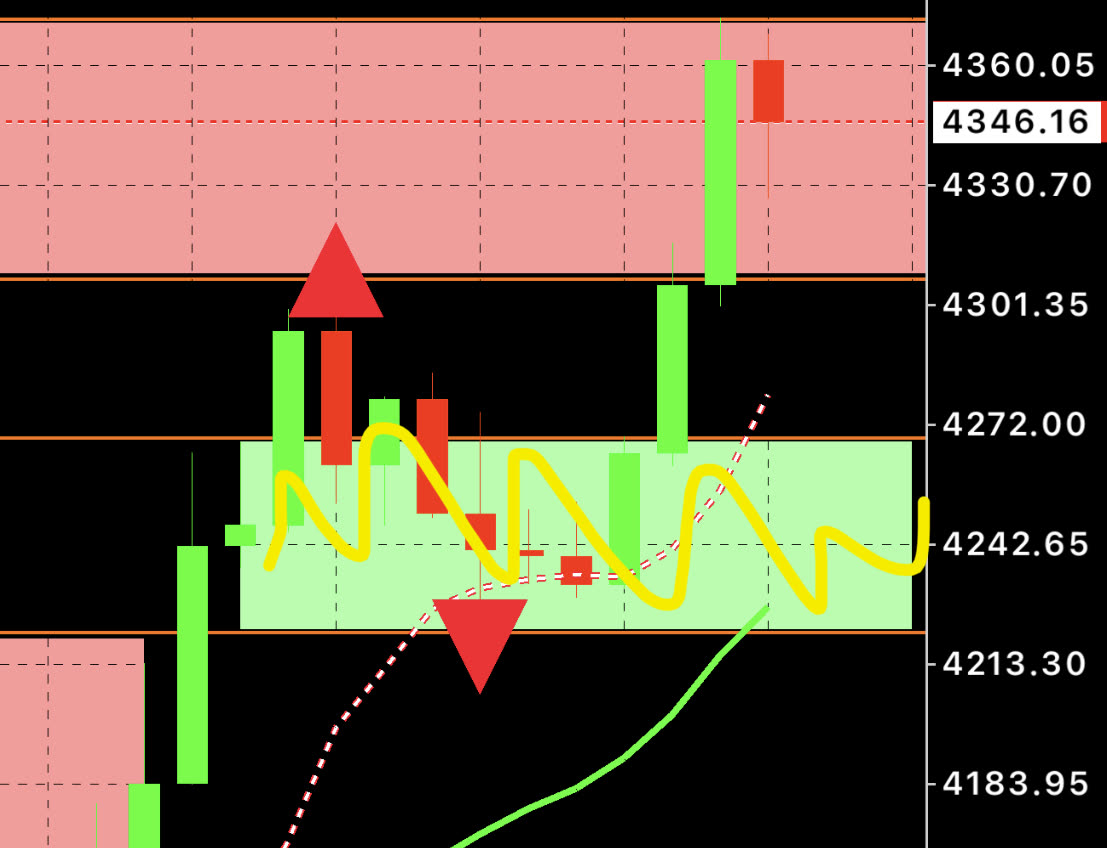
- He sees possible accumulation, meaning a stretch where buyers may be quietly building positions, and says the whole area around the doji candle could be that.
- Alan checks the jobs data and explains that a stronger than expected non farm payrolls number would usually mean gold down and the dollar up.
- He says sentiment shows no clear direction, with retail traders mostly short, which sits opposite to what he believes the institutions are doing.
- Price is entering the supply zone, so Alan says adding longs is late. He does not trade news or open new positions on a Friday, so he waits.
Alan's notes for the day
Perfect bounce off the resistance level of the supply zone!
New demand zone!
The Learn to Read a Forex Chart course teaches this step by step. You can start free and learn at your own pace.
Learn to read a chart, start freeSee the robotQuestions about this chart
What is a supply zone on a gold chart?
A supply zone is a price area where sellers have appeared before. On this four hour gold chart, price has climbed into one, and Alan says it is late to add buy trades there.
Why does Alan Solarsh not trade the news?
He says news can leave the direction unclear, so he relies on the chart instead. On this day he checked jobs data but still chose to wait and watch what the institutions do.
What is accumulation on a forex chart?
Accumulation is a stretch where buyers may be quietly building positions. Alan says the area around a doji, a candle with a tiny body, could be accumulation on this gold chart.
Read next
- Learn To Read A Forex Chart, the free course
- All trade analysis videos by Alan Solarsh
- Forex education articles
- See the Forex Robots
Forex trading carries risk. This is education from my own chart, not advice or a signal.
