
Trade analysis
Daily chart analysis by Alan Solarsh
Alan walks through the market chart on video, every trading day. Each page has the video, the key points in writing, and any notes or pictures he added that day.
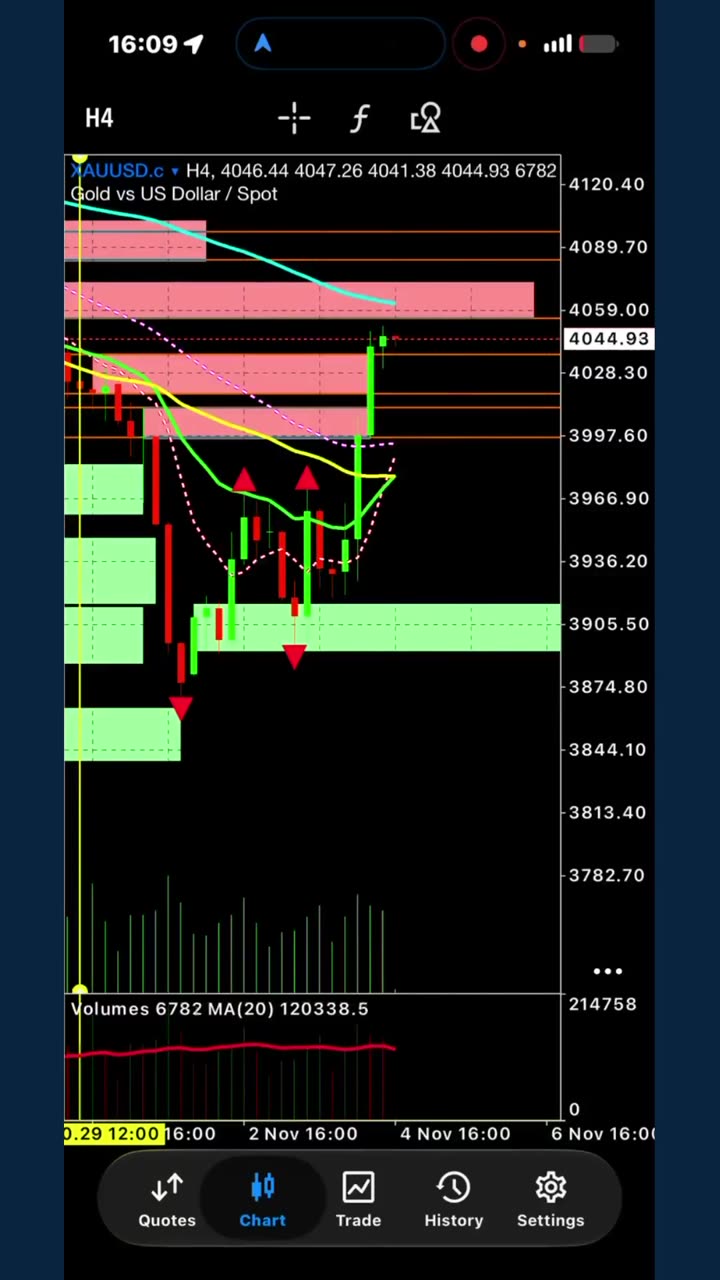
Gold Chart Analysis: Demand and Supply Zones
Alan marks new demand zones on gold after several supply zones were broken.
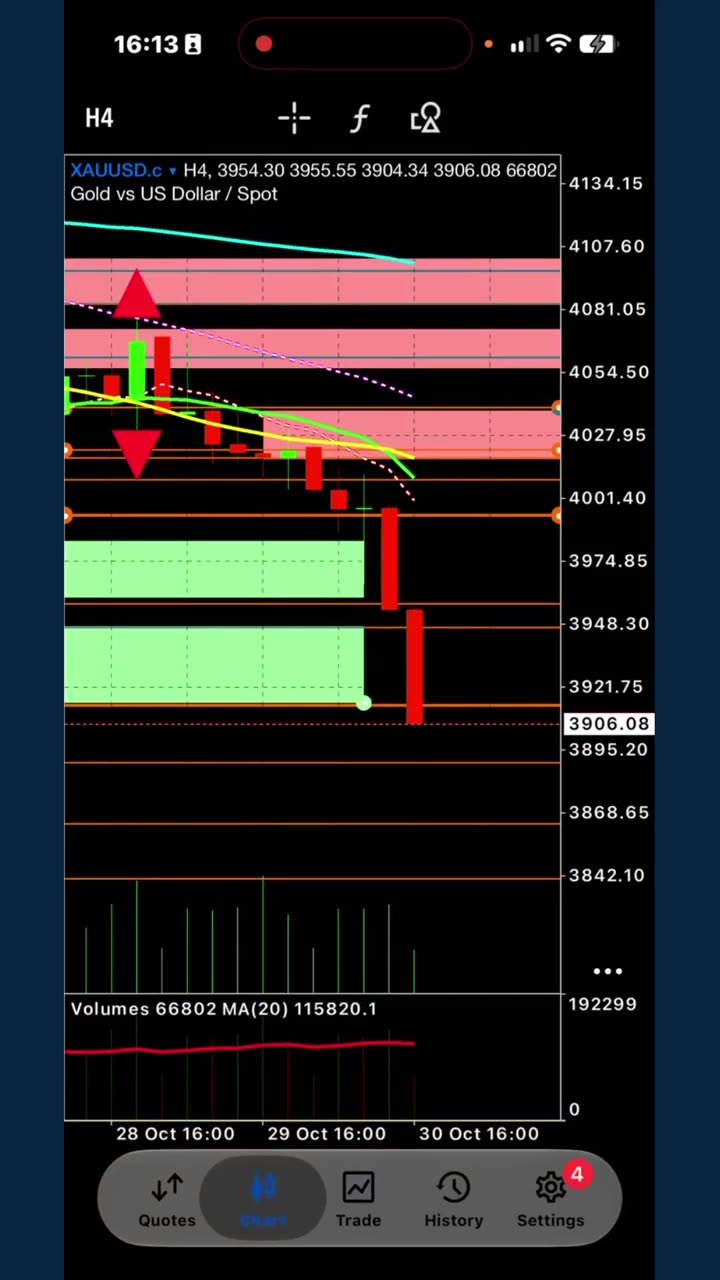
Gold Four Hour Chart Demand Zones and Lines
Alan walks through a Gold demand zone, explaining how he draws it and when it counts as mitigated.
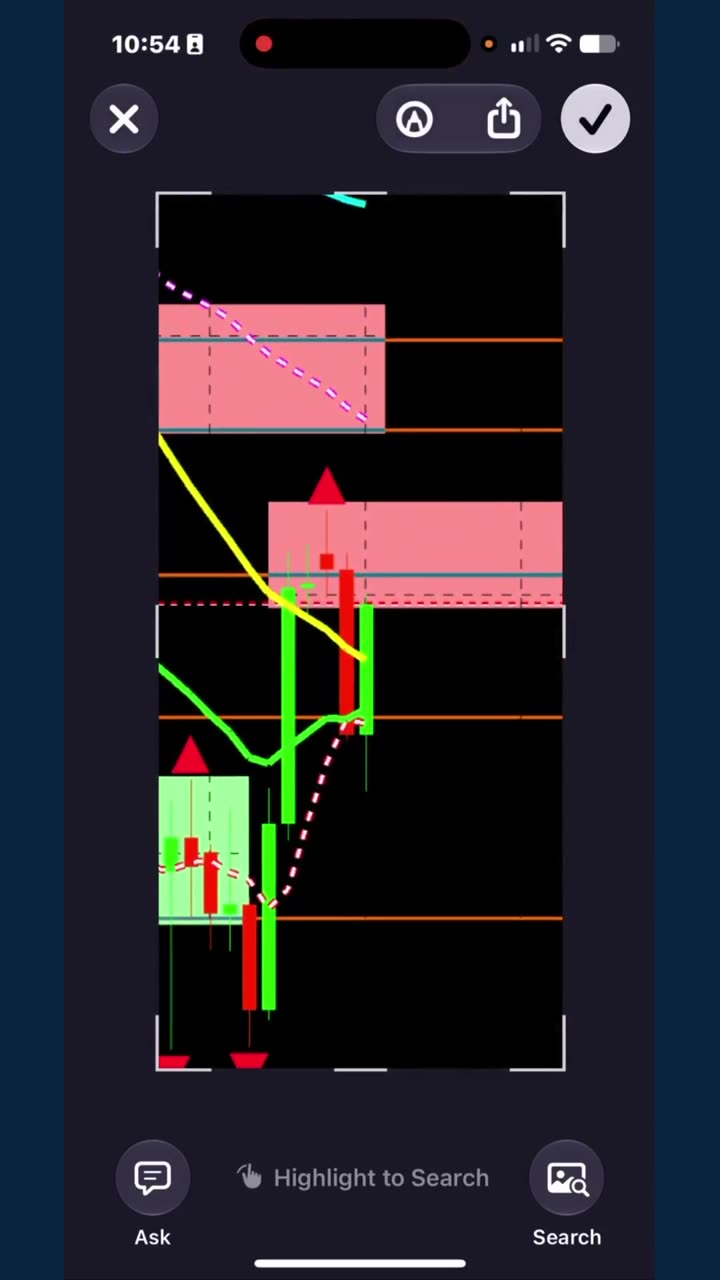
Gold H4 Chart Price Rises Into a Supply Zone
Gold on the H4 chart rose into a supply zone, and the question is whether it holds.
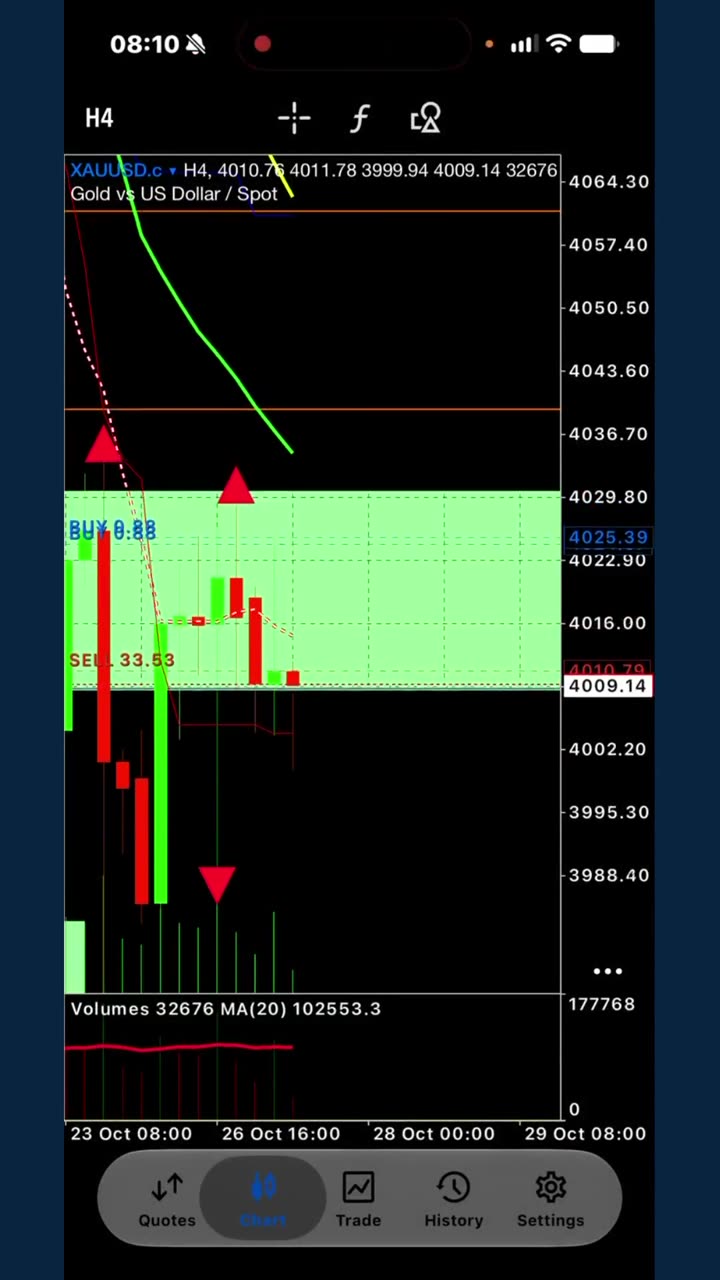
Gold Demand Zone Mitigated, Supply Zone Drawn
Alan Solarsh shows a gold demand zone being mitigated, then draws a new supply zone above it.
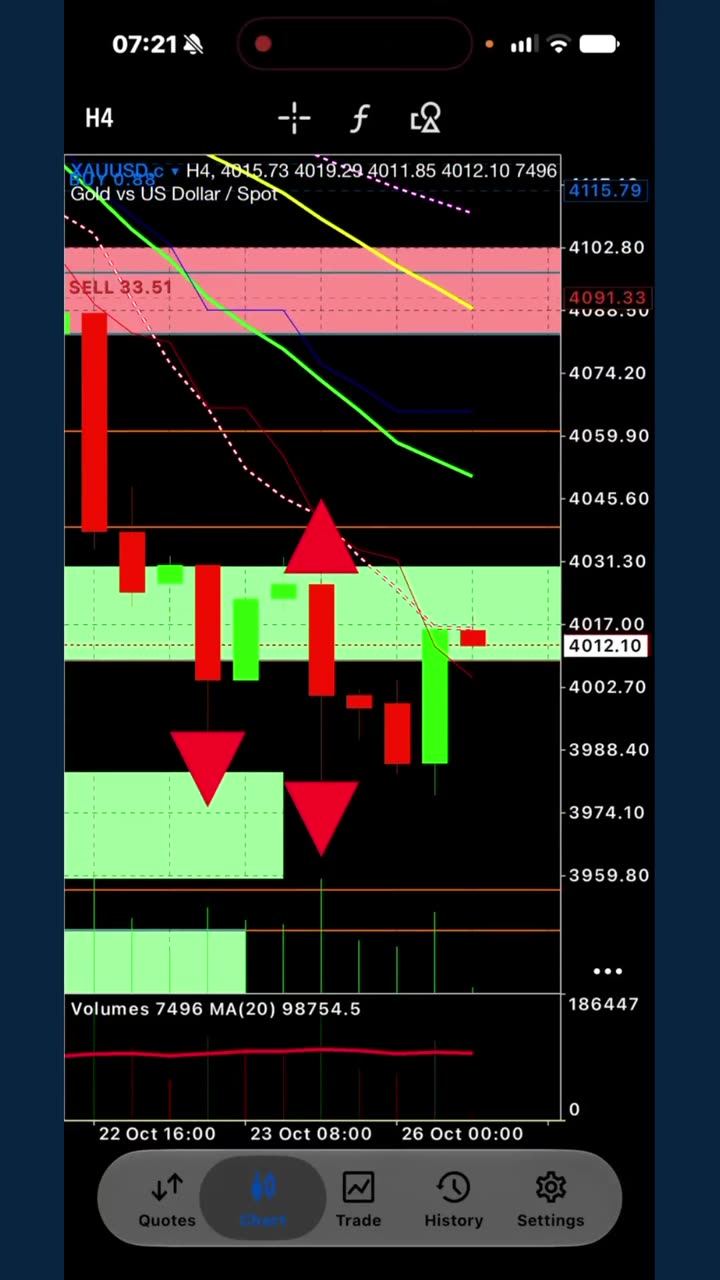
Gold Chart Analysis: Morning Star Never Formed
Gold did not form the morning star Alan hoped for, so he wants a fractal break first.
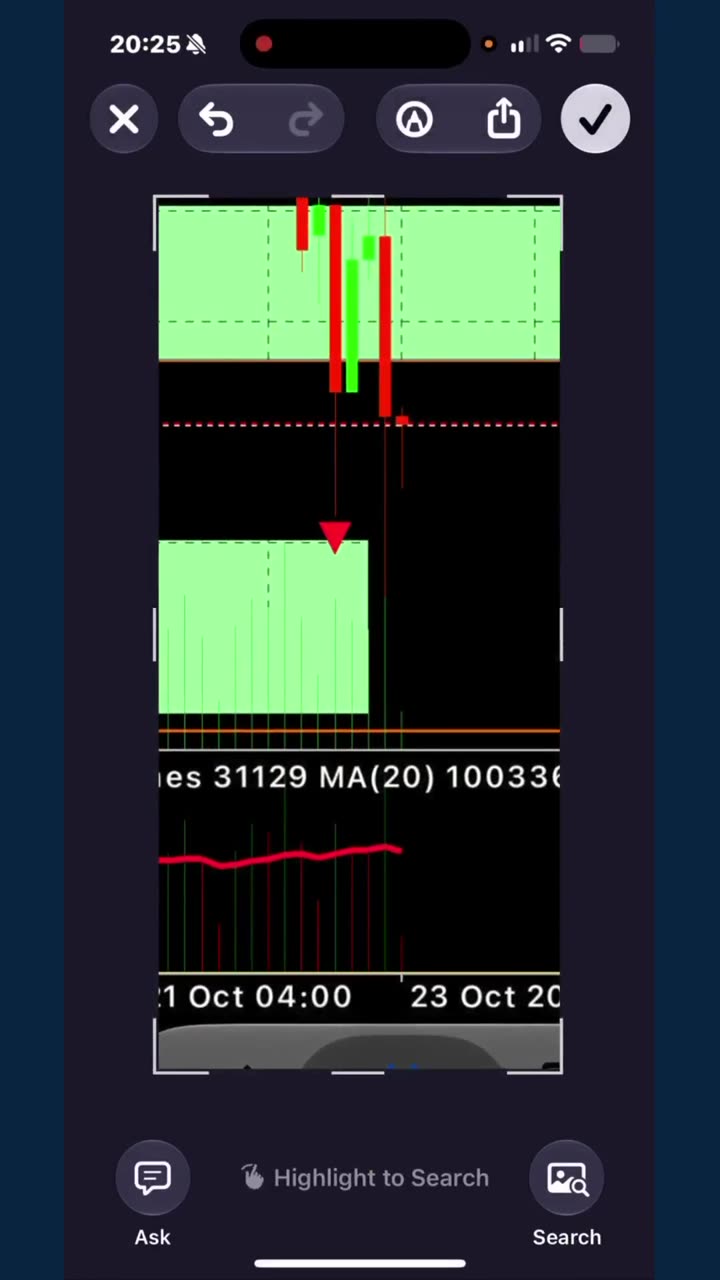
Forex Chart Liquidity Sweep Into a Demand Zone
Alan Solarsh points out a liquidity sweep into a demand zone and the candles that followed it.
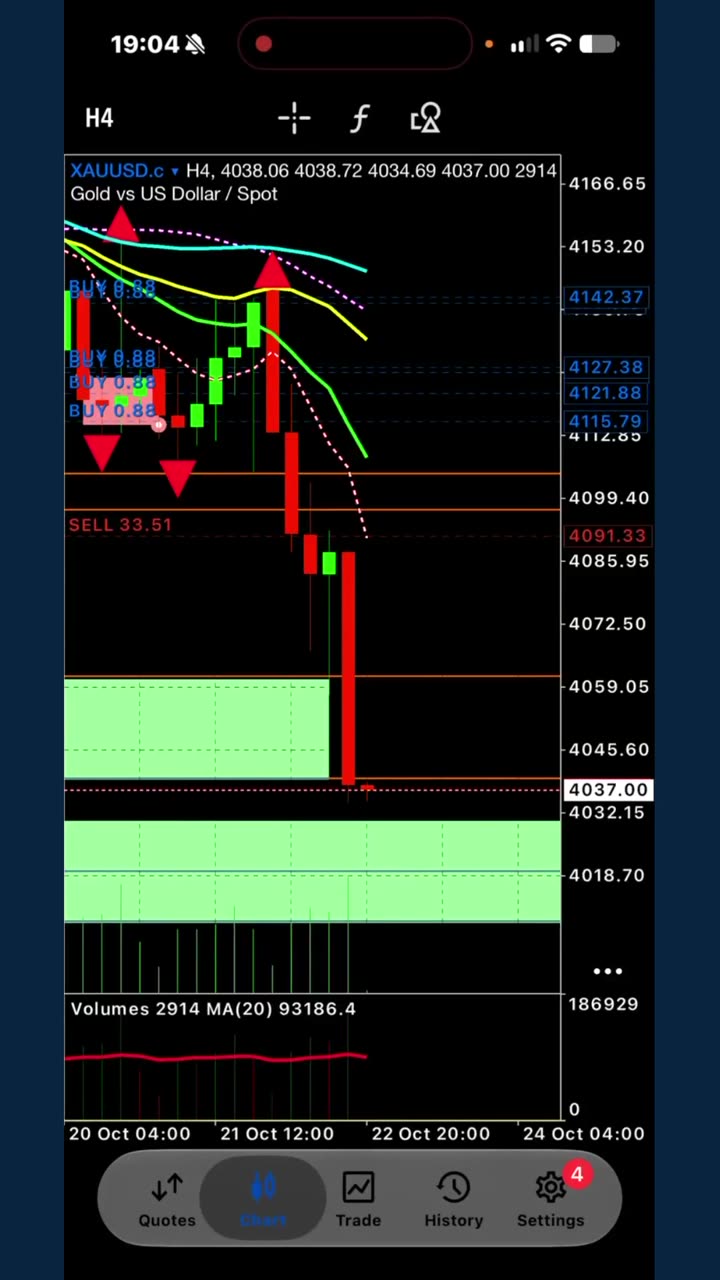
Gold H4 Chart Analysis: A Broken Demand Zone Explained
This gold chart analysis shows 1 broken zone in about 4 minutes.
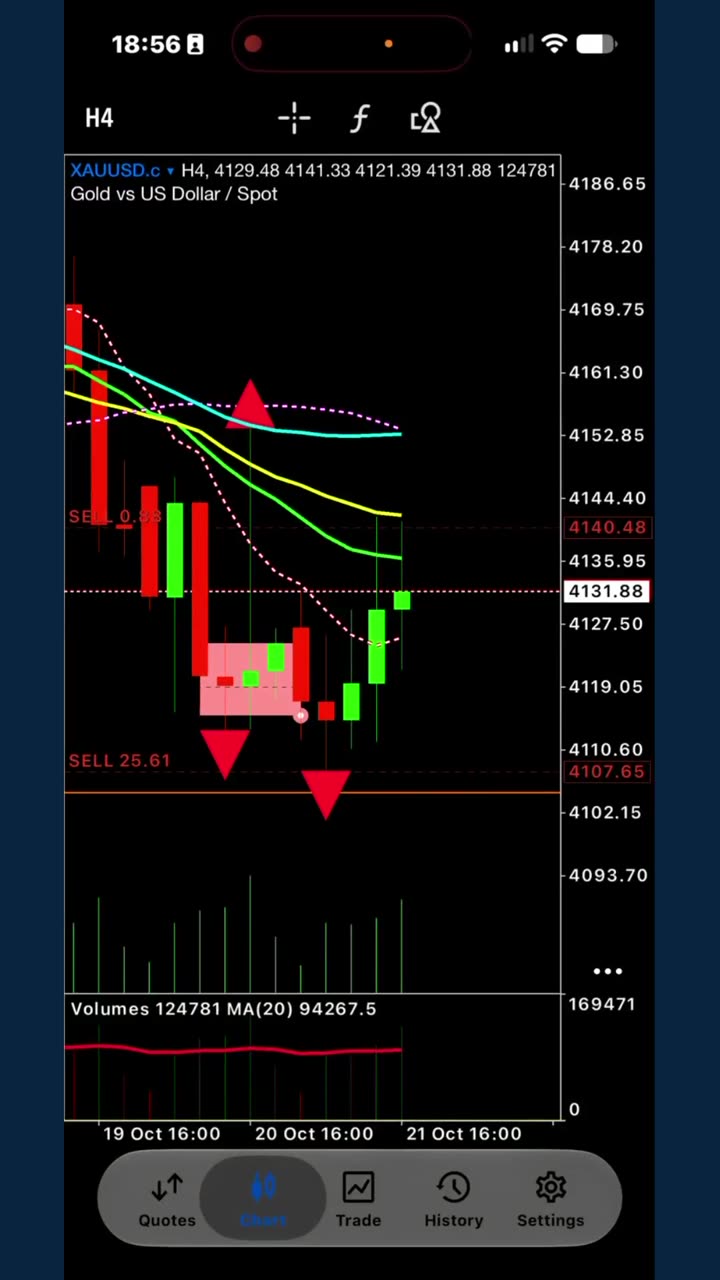
Gold Sideways Channel and Demand Zone Explained
Gold has moved sideways since 28 September, and Alan marks a demand zone.
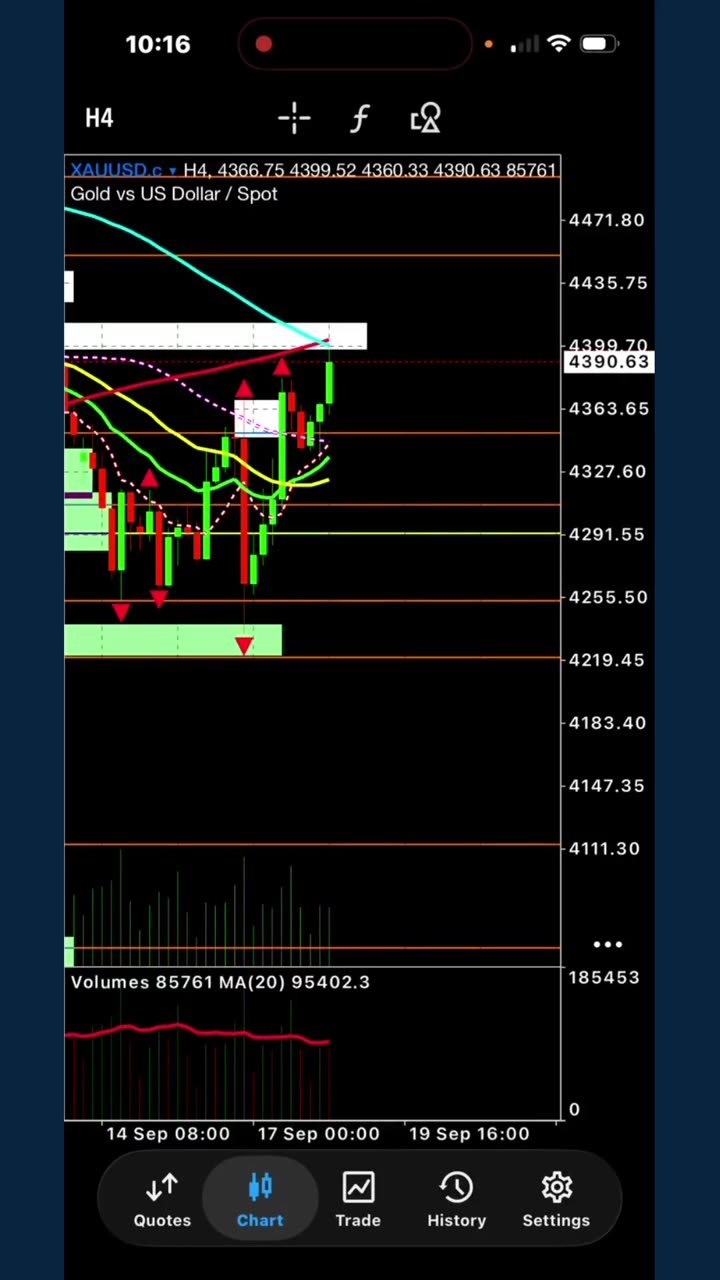
Gold Chart: Moving Averages Squeezing Together
Alan shows gold moving averages squeezing together and explains how he reads it.
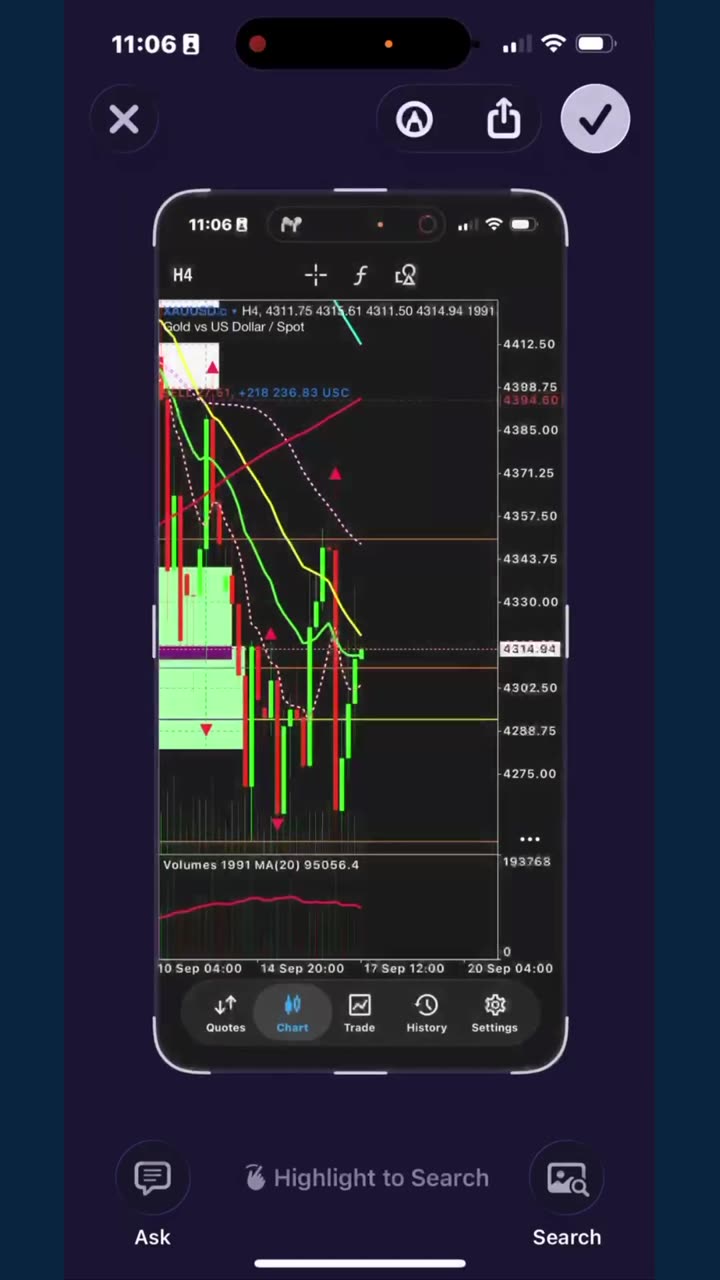
Gold Chart Analysis: News Candle and the 200MA
Alan Solarsh followed gold through a news driven candle, a white maybe zone, and a busy 200MA area.
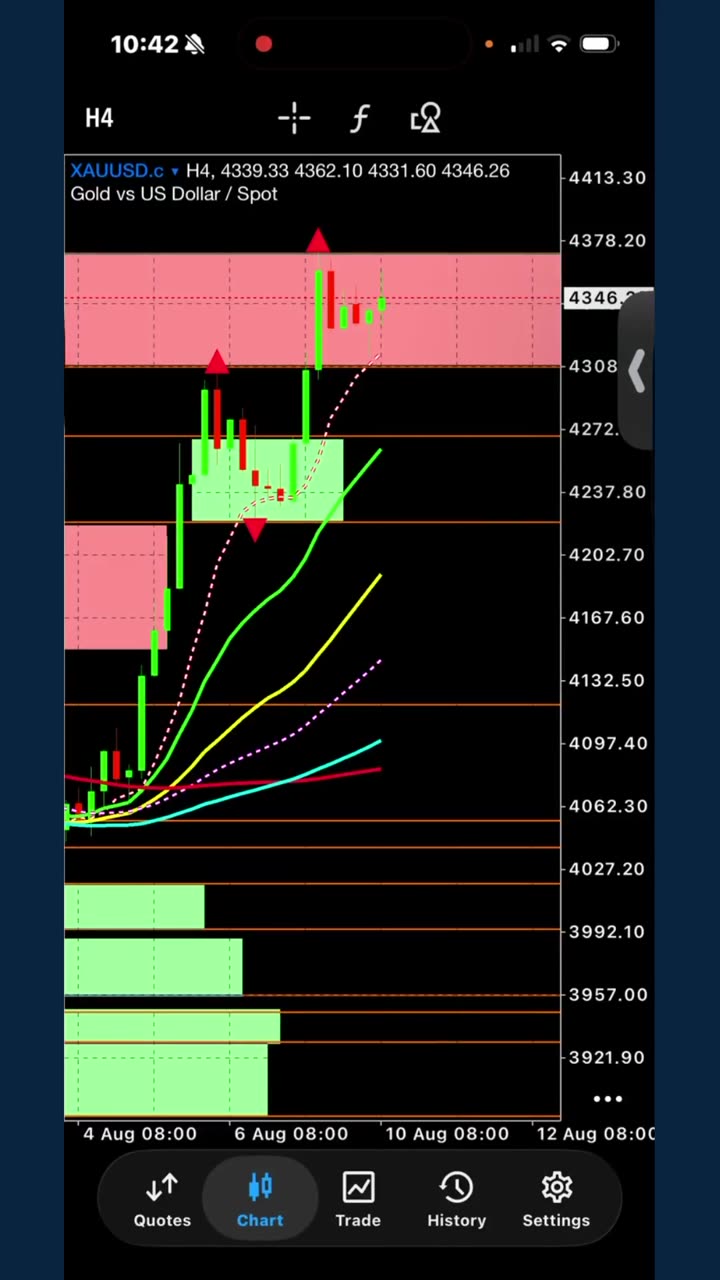
Gold Chart Stuck in a Supply Zone Before CPI
Gold sits inside a supply zone ahead of Wednesday's inflation report and Fed rate decision.
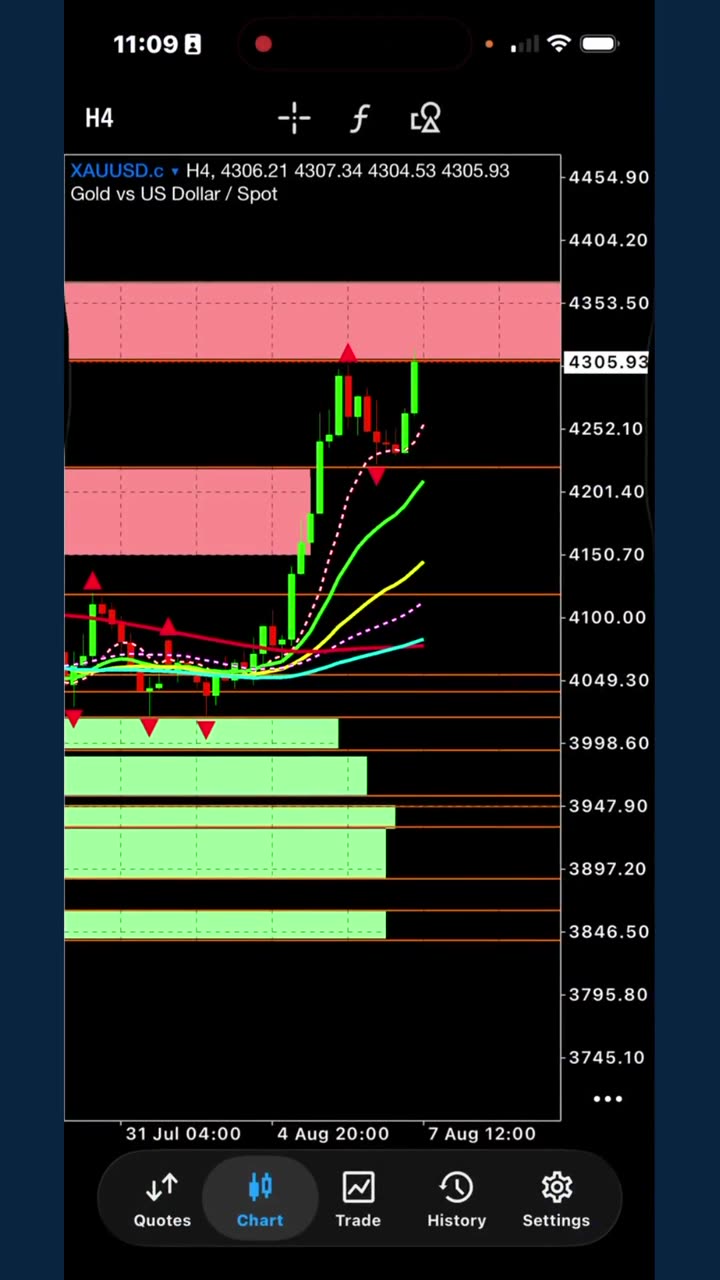
Gold Four Hour Chart and Supply Zone Review
Alan Solarsh marks a supply zone on gold, checks jobs data and sentiment, then chooses to wait on Friday.
Questions
What is the daily trade analysis?
A short video where Alan Solarsh walks through the chart he is watching that day: the zones, the candles and what they mean. When he posts more that day, it is added to the same page.
How long is each video?
Most are a few minutes long. Each page also has the key points written out, so you can read it instead of watching.
Is this a trading signal?
No. It is education from Alan own chart. It is not advice and it is not a signal. Forex trading carries risk.
How do I learn to read a chart myself?
Start with the free Learn To Read A Forex Chart course, linked on every page.
