
Trade analysis
Gold Chart Analysis: News Candle and the 200MA | 17 September 2026
By Alan Solarsh · 17 September 2026
Alan Solarsh followed gold through a news driven candle, a white maybe zone, and a busy 200MA area.
What the chart shows
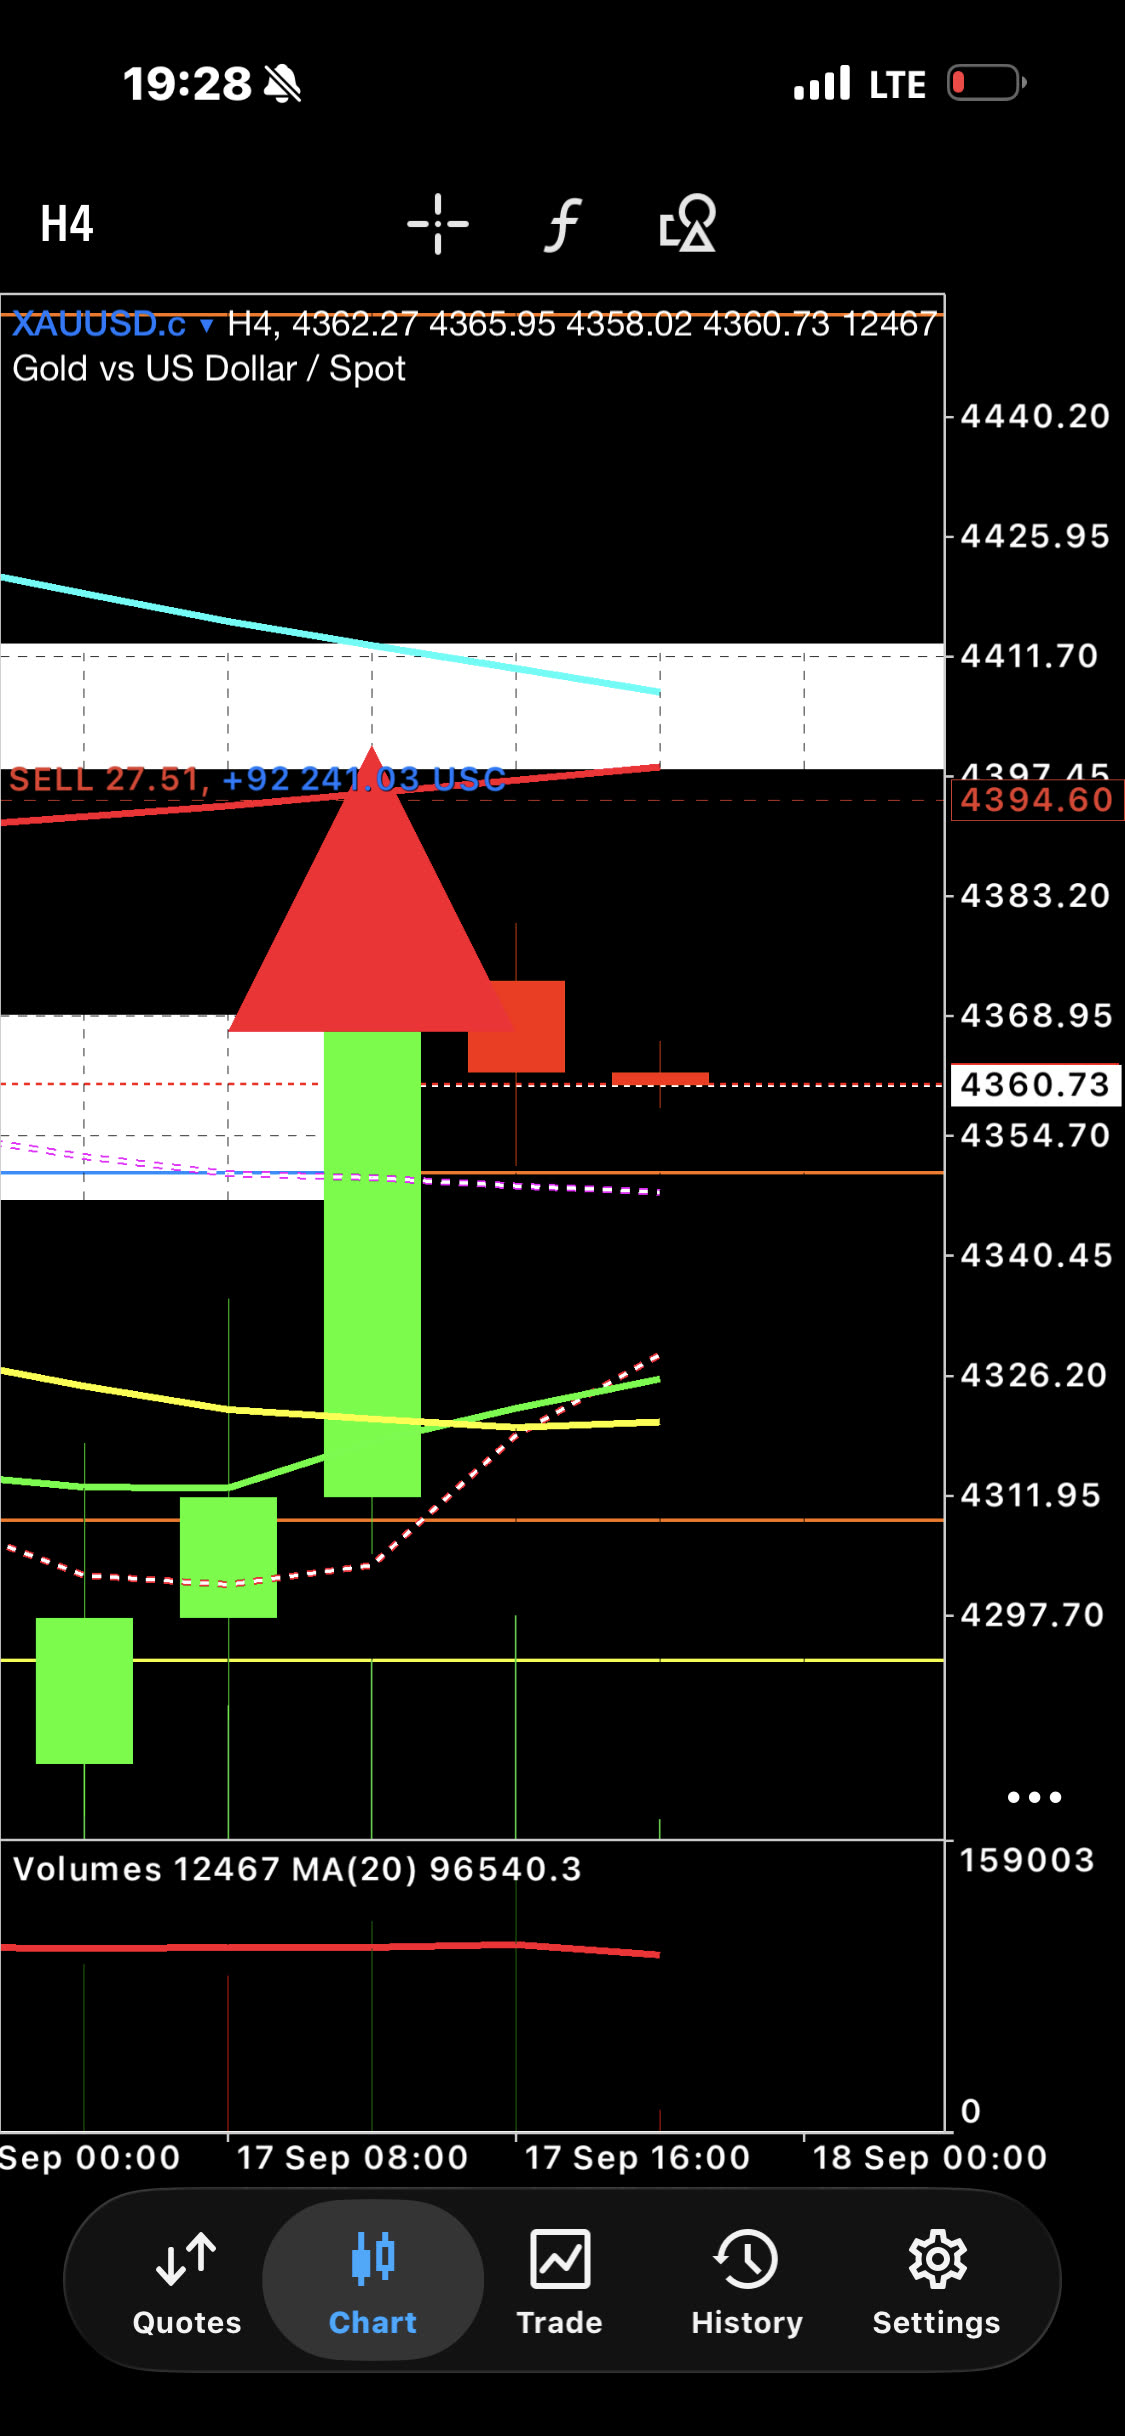
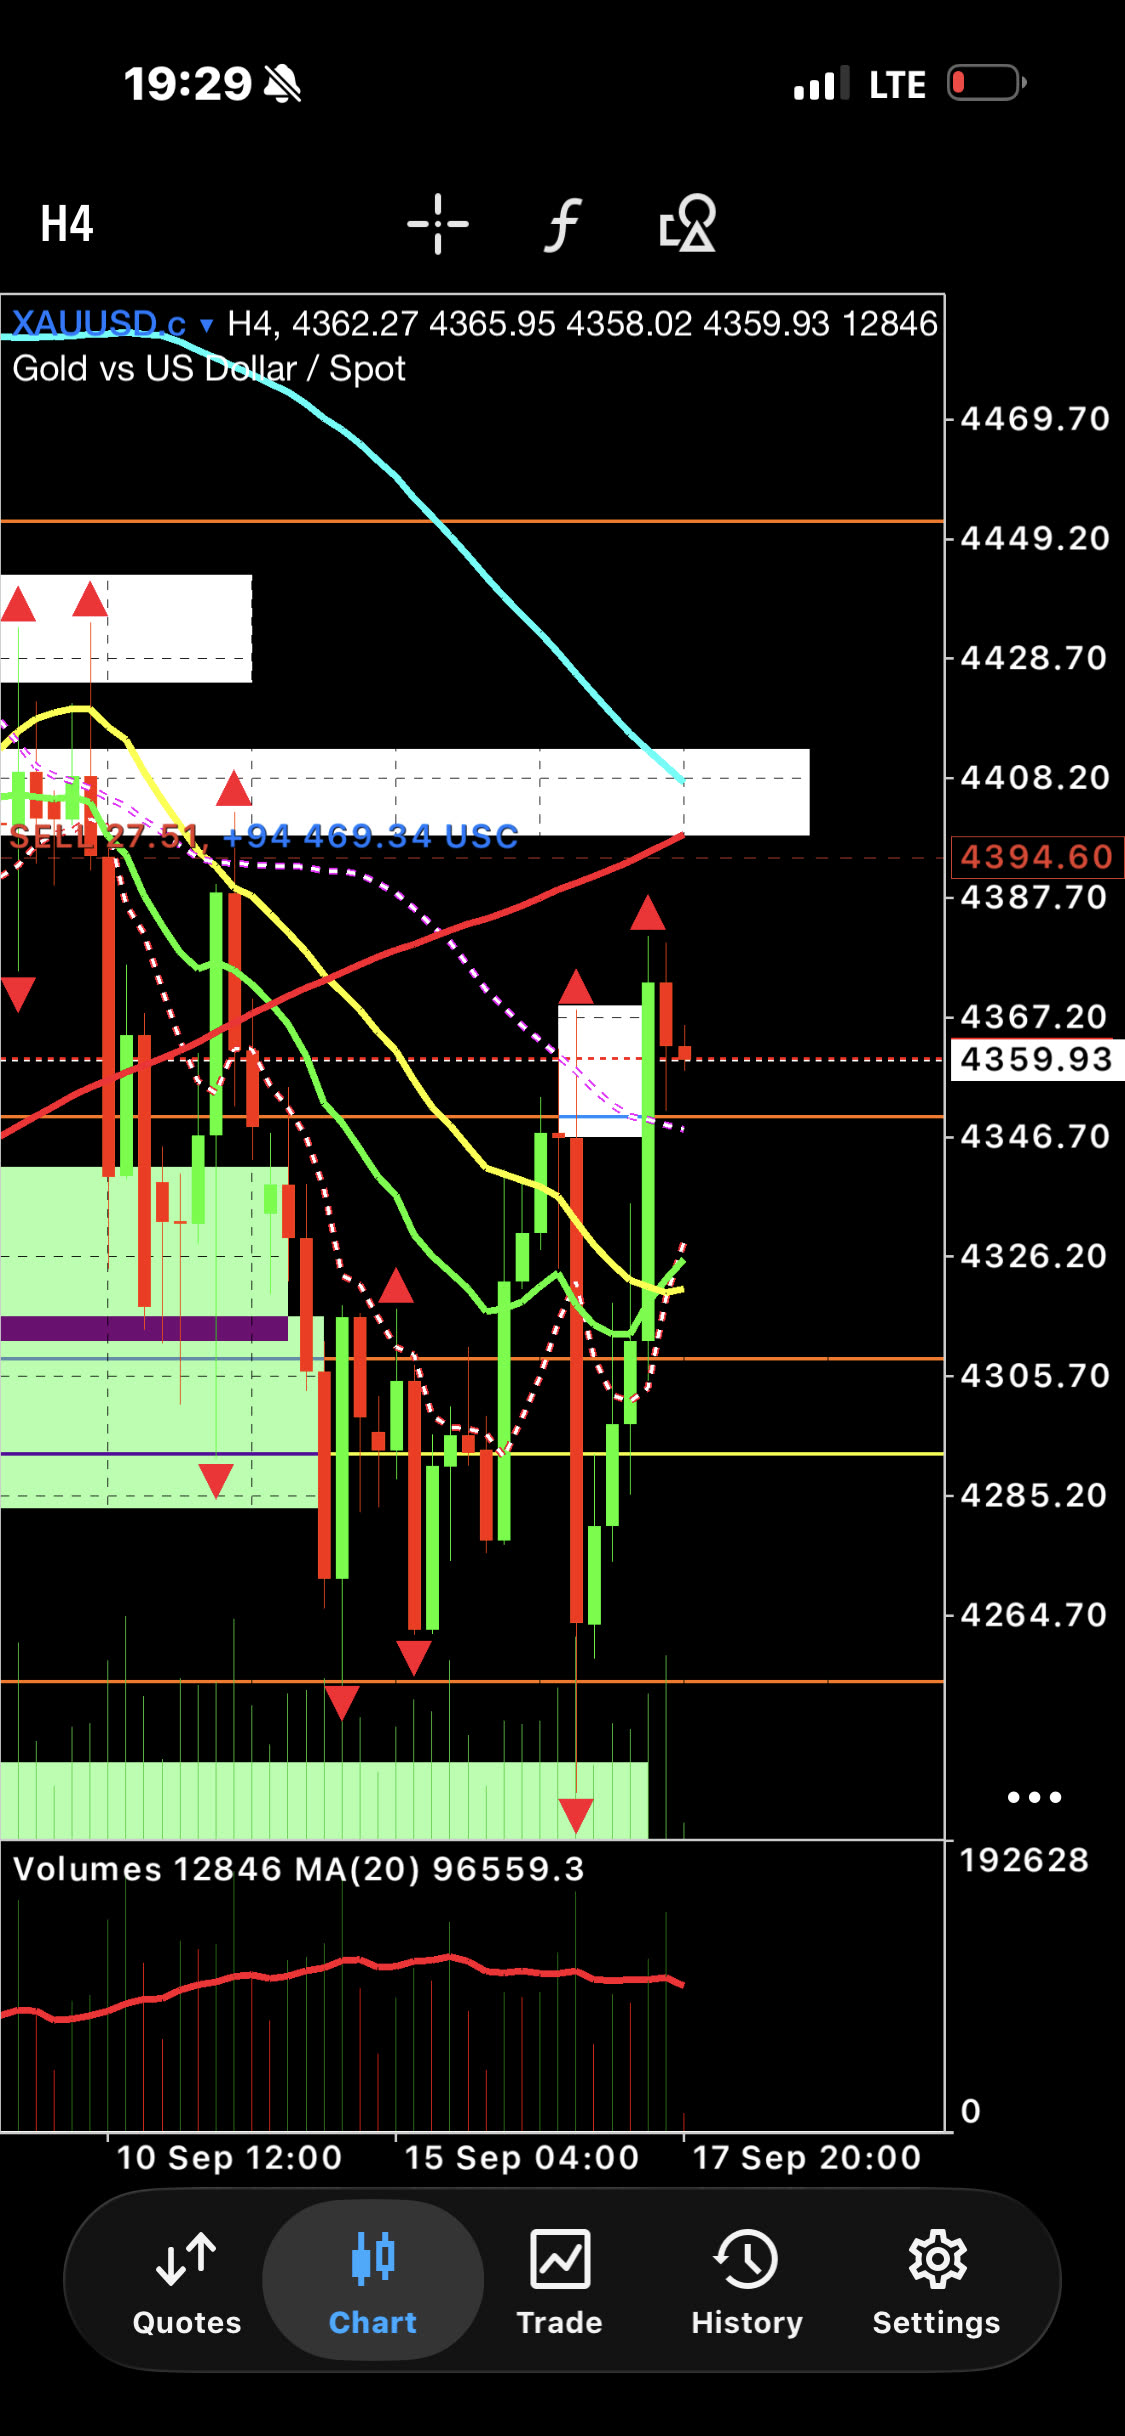
The big red candle came from a news event, so no zone was drawn. A supply zone is an area where sellers pushed price down before. A doubtful area can be tinted white as a maybe, then watched.
Beginners with day jobs can keep charts clean by asking what caused each candle.
Key points from the video
- Alan did not draw a supply zone on the big red candle because it came from the FOMC news announcement, not normal selling. A supply zone is an area where sellers pushed price down before.
- He tinted the doubtful area white as a maybe supply zone and said it needed watching. Later he noted that the white zone did not last long.
- Alan pointed out price sitting on the 50MA, a moving average line that he treats as resistance, meaning an area where price has struggled to rise.
- He said anything within 80 dollars of the 200MA is a no trade zone for him, and he listed a supply zone just above it from 4398 to 4413.
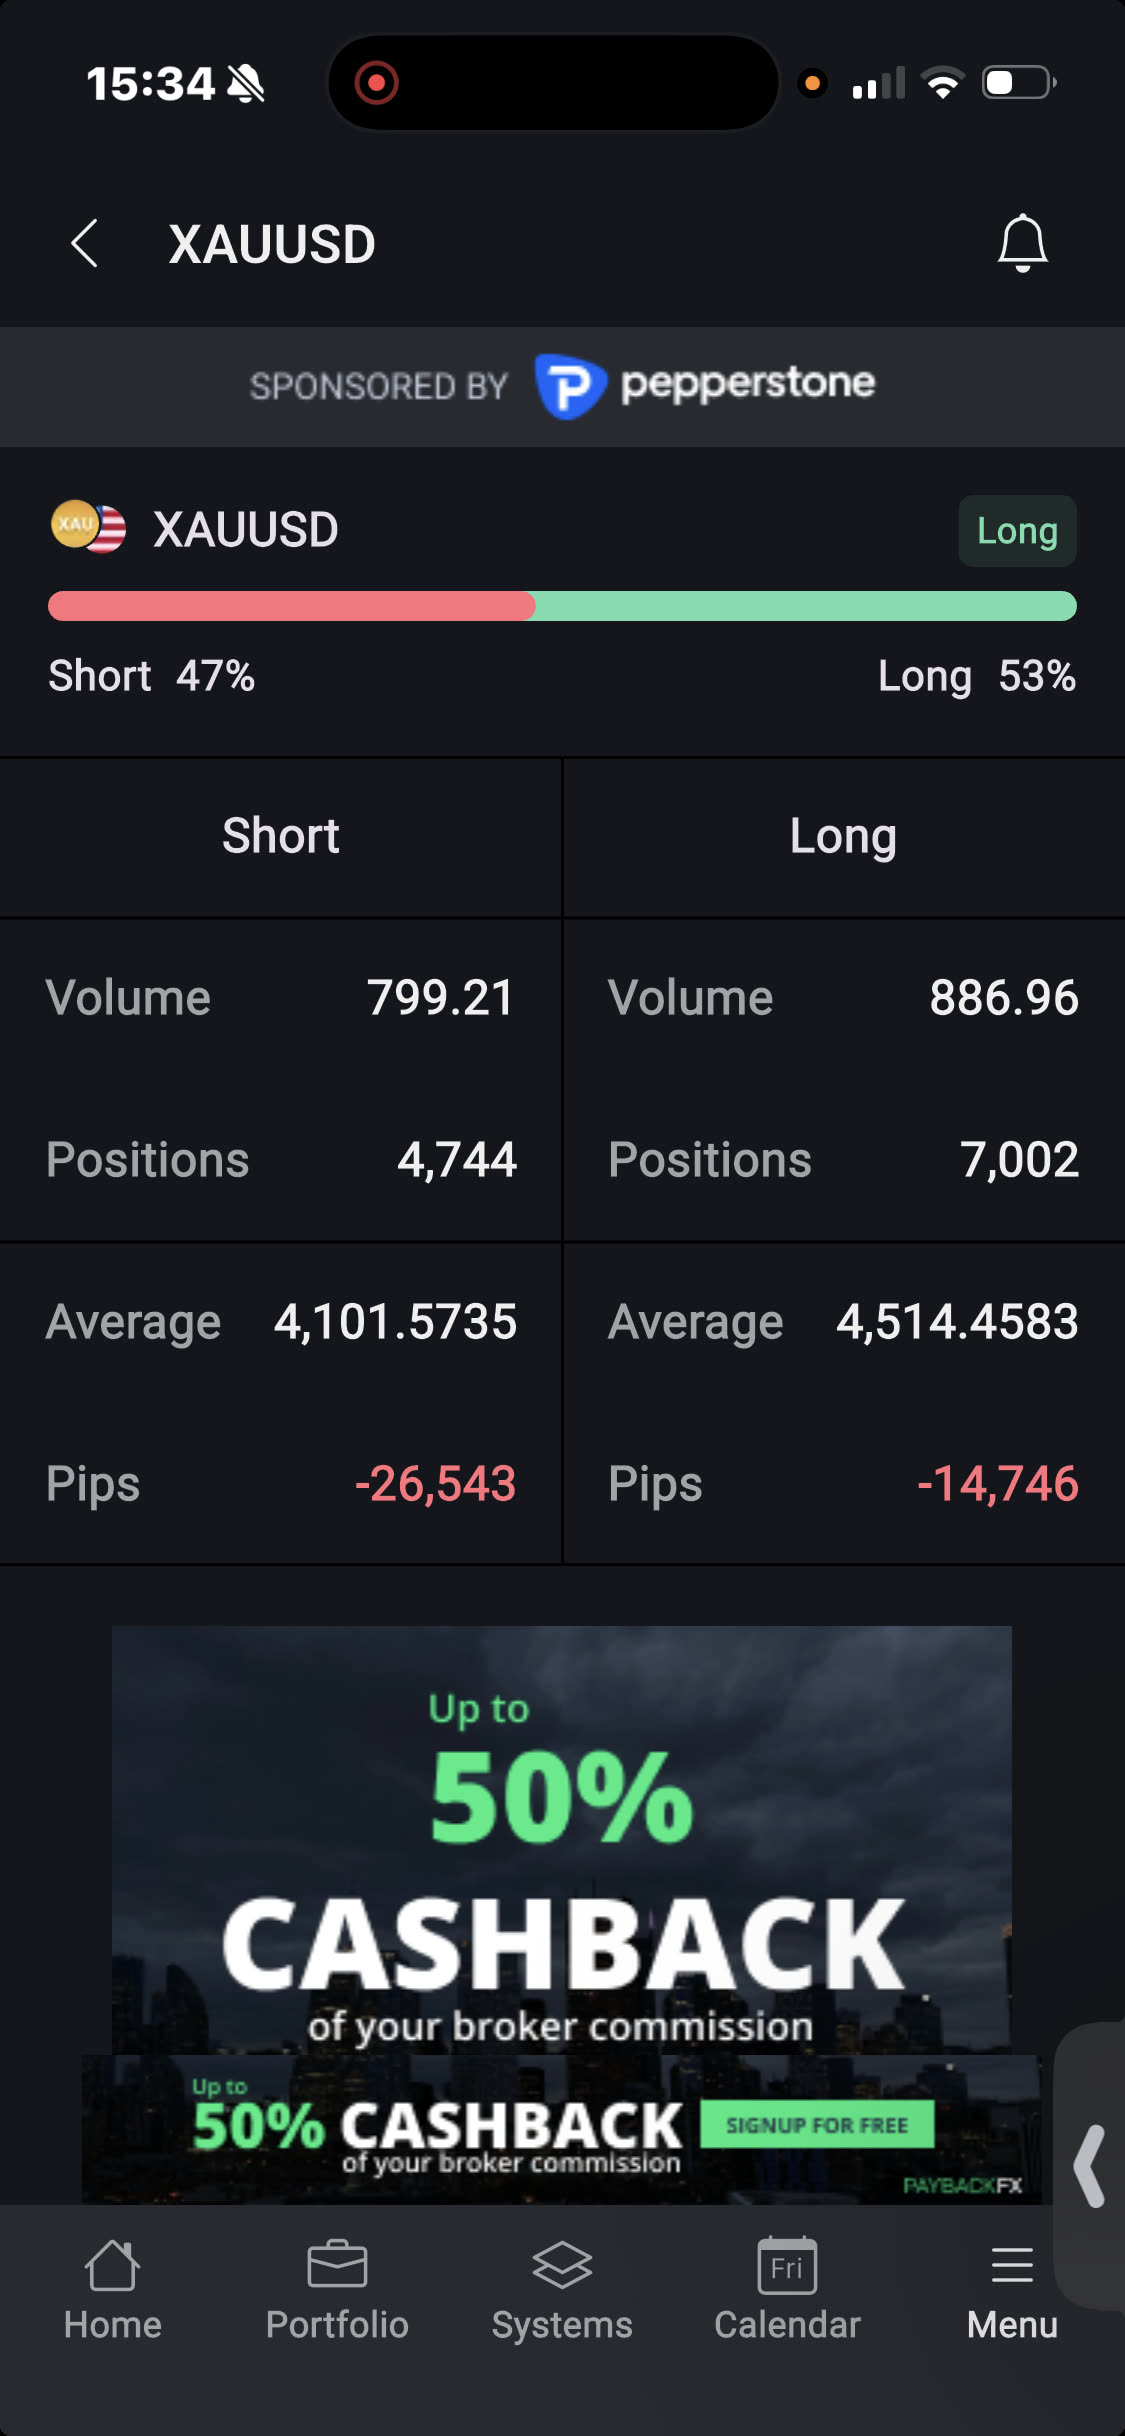
- On the sentiment screen, the average long entry sat near 4514, and Alan said that showed many traders had opened trades close to the recent high.
Alan's notes for the day
It may be too late unless your hedge is north
**Listen carefully my friends**
New candle opens in 2 min
Price is at the doji where the price fell yesterday after the news
I think this is another bull trap
this spike is the closing of a 4h candle
abnd we are right on the 50ma which is resistance
look how it has paused .
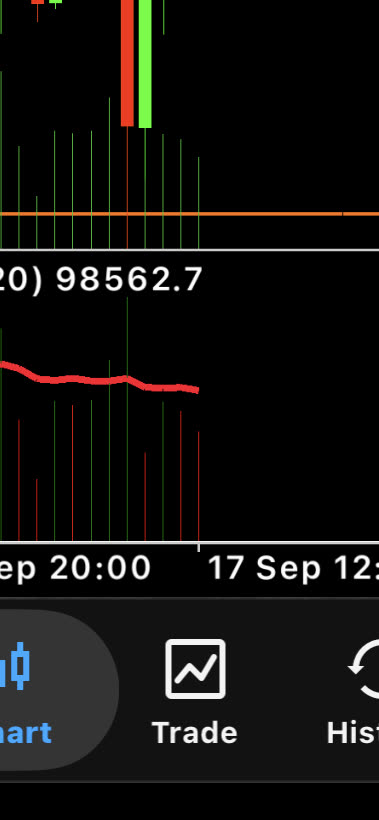
huge movement and look at the momentum
There is nothing there
all lines are below the 20ma
let's wait
sorry candle opens in 1 hour
not now
This is a massive candle and spike
We're now in the white supply zone
I'm in hold for now
it's now a 100% retracement from yesterdays move.
and that 50ma resistance is real!
What is interesting is the momentum it;s so low
I'm also not going to place a BB trade so far away from the 8ema.
The market has moved inefficiently and a retracement is imminent. I'll wait
Regarding my hedge.... I'll let my tp trigger. I'll make very little. Such a wasted opportunity but you can't win them all.
my hedge at 1 stage was $3k
I think the price is going to tank 5 minutes after the new candle opens
We also poiecred the fractal and the white supply zone.
I think this is another bull trap
Generally when you get such a huge candle it retraces at least 30-50% on the next candle
2nd candle $20 below the 200ma NTZ!!!!
that's my answer
We're too close to the 200ma for me to trade. it's a NTZ $0 - $80 from 200ma is NTZ update your memory
oil sits on the 50ma on h4 (200ma on h1, hard resistance) and has hit a wall.
Dxy hard wall on 200ma
explain "That's a rising opportunity cost,"
EXpalin you institutional MA's (Sames as mine)? list them.
I'm leaning fade.
Similar to your reading. as there is a supply zone just above the 200 ntz at 4413 - 4398 and 4300 psychological level. Going to be tough to break that with interest rates where they are and gold yielding 0% returns where the institutions can rather opt for a no hold rental fee and a yield producing asset.
Sentiment is still 47% 53%. This can go either way but I think this was a bull trap and the price is going to go 200ma then south.
and you got 200ma & 100 ma Resistance converging
Longs: 4,514 average, sitting -14,746 pips. Retail is trapped from way up top. Every dollar this rally climbs toward 4400+ is a trapped long getting closer to breakeven - and trapped longs sell into breakeven, they don't add. That's a second layer of supply stacked right on top of your 4398-4413 zone and the 200MA at 4397. Retail exit orders and institutional supply at the same shelf.
explain this for me in a simple analogy please this is higher grade form me
Real 10-year at 2.68%, nominal up 18bp on the week - the macro is charging rent on every long. are you refering to swaps?
oh wow i just learnt something. Amazing.
this proves my point that all or most traders on myfxblue are using a irresponsibly made DCA EA wit no pause. Proven by the average of long opened sat 4514.
My trades are also there at that price... WHY? I didn't listen to my own EA rules of pause at ATH and activate DCA and force trades $80 below ATH. This is a game changing lesson. Thank you. Now we all understand the numbers in the sentiment.
and look at the average Shorting $4101 sadly rediculous.
And this is why 98% of traders blow out.
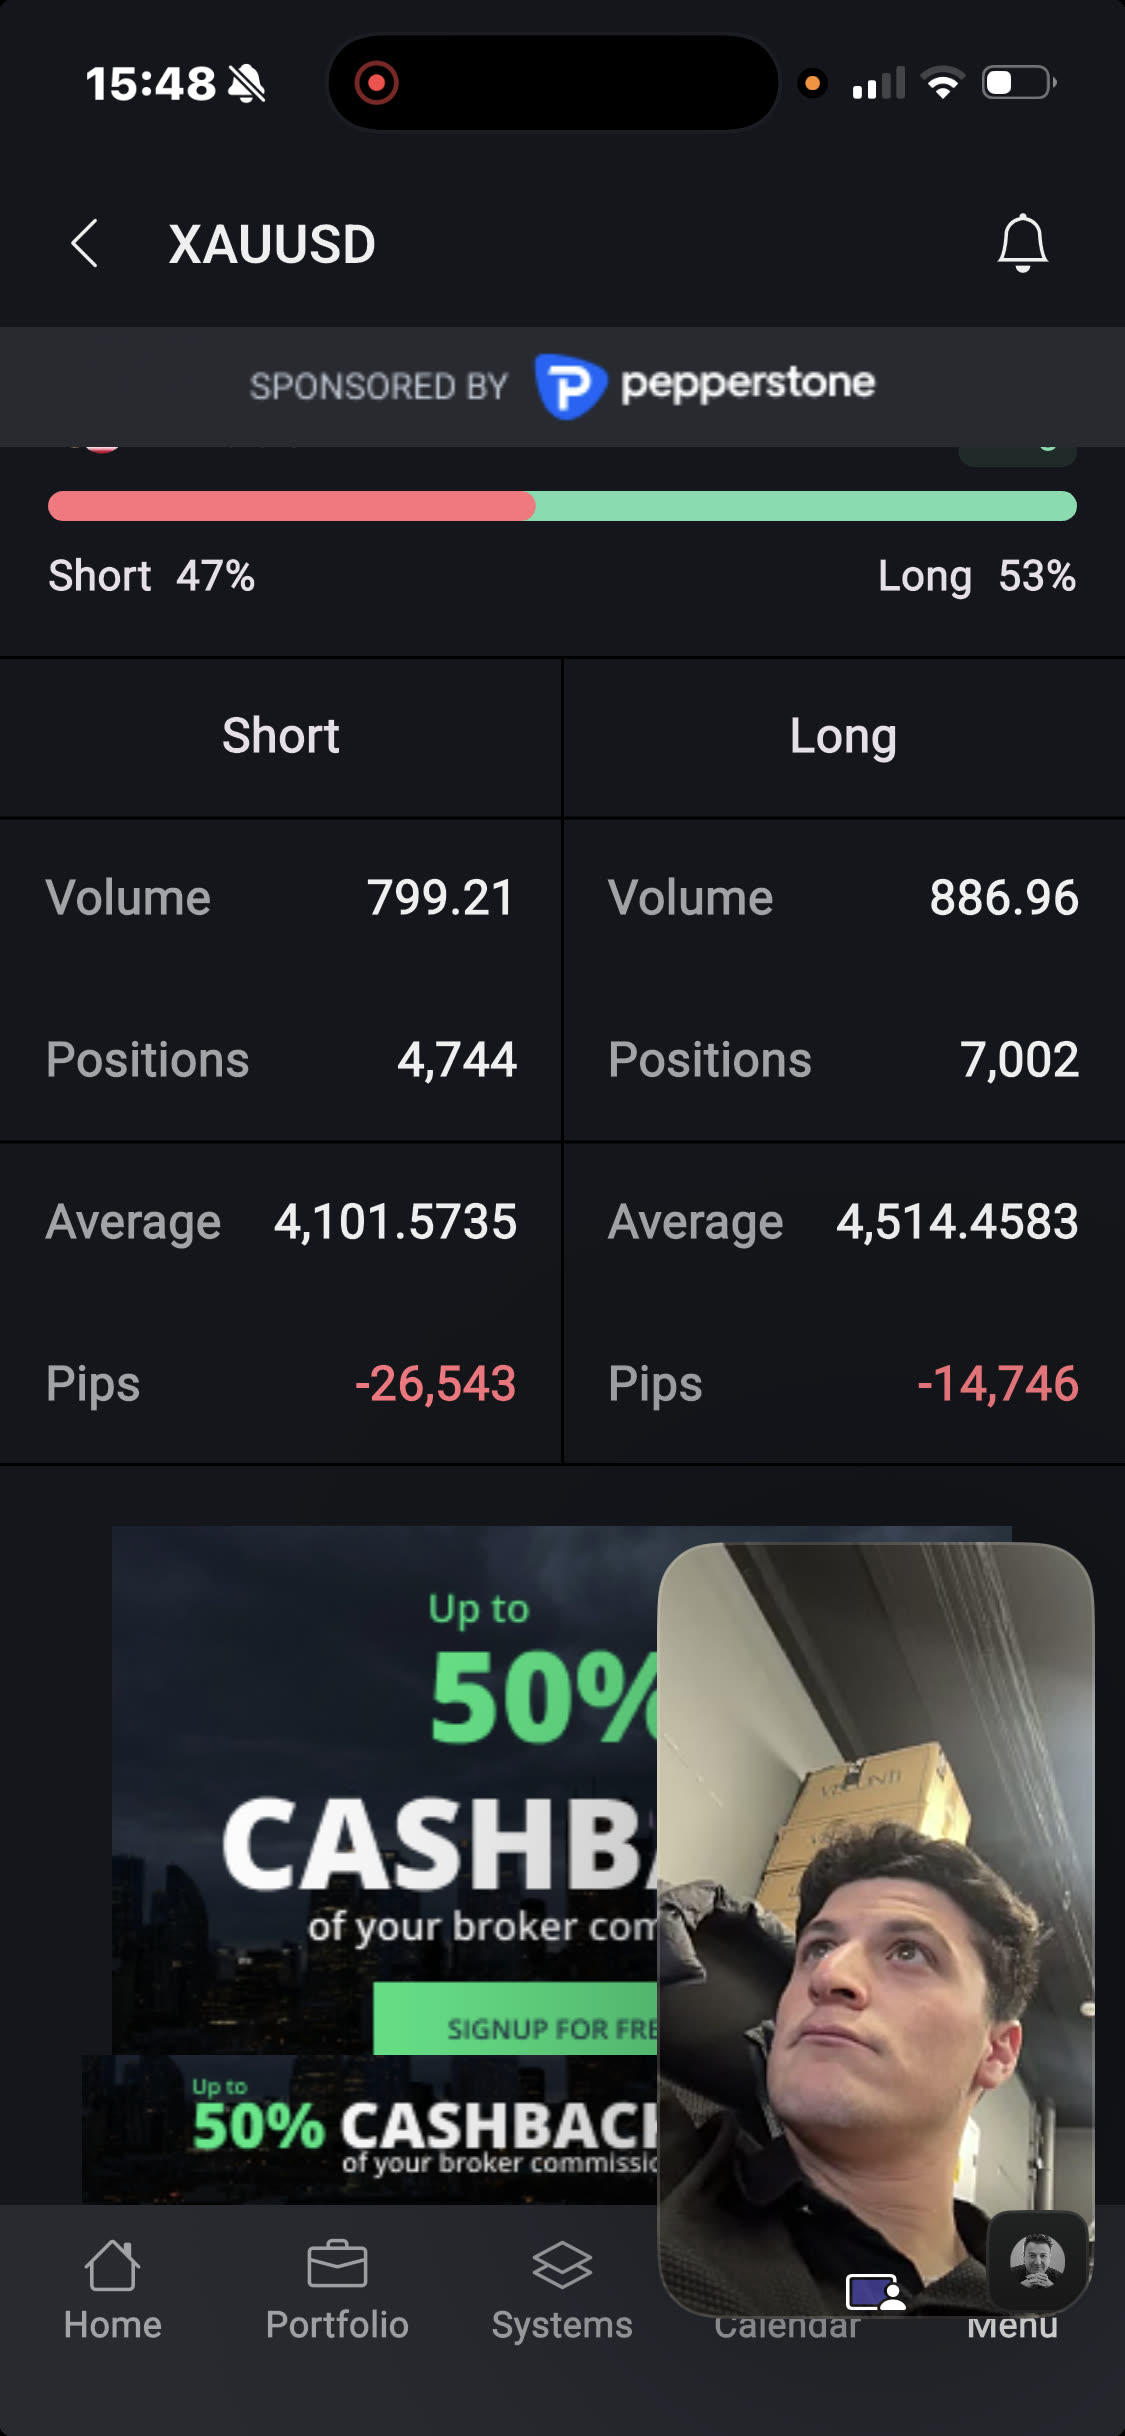
explaim the volume on sintiment screen is that amount of trades open?
Quick check: on your screen, does the split look the same when you compare it by volume vs by positions? If they diverge, that tells you whether it's the crowd or the big accounts leaning short. not sure tell me more
I disagree with you on a couple of things. The fact that there are fewer shorts and larger positions, could that not be the broker's hedging on B-book? That's the first thing.
The second thing is you mention you talk about the divergence. Follow the volume side but the volume side could be retail and the short side could be broker hedging. But the SARS is not leaning short. It's leaning long so I'm confused there.
Or this is all dumb money and means nothing because they're all using dumb EAs
Check the volume
Something g is happening here
Oh and as I said that white supply zone didn’t last long
So you’re saying that the candle closing red is a big tell? Distribution? Not long accumulation
The Learn to Read a Forex Chart course teaches this step by step. You can start free and learn at your own pace.
Learn to read a chart, start freeSee the robotQuestions about this chart
Why did Alan not draw a supply zone on the big red gold candle?
Alan said the large red candle was produced by the FOMC news announcement, so he did not believe it marked real selling. He tinted it white as a maybe zone and watched.
What is a no trade zone around the 200MA on a gold chart?
Alan treats the area from 0 to 80 dollars away from the 200MA as a no trade zone. He said price was too close to the 200MA for him to trade.
What does 50MA resistance mean on a gold chart?
A 50MA is a moving average of the closing prices of the last 50 candles. Alan pointed to price pausing on it and called it resistance, an area where price has struggled to rise.
Read next
- Learn To Read A Forex Chart, the free course
- All trade analysis videos by Alan Solarsh
- The previous day's chart analysis
- Forex education articles
- See the Forex Robots
Forex trading carries risk. This is education from my own chart, not advice or a signal.
