
Trade analysis
Gold H4 Chart Analysis: A Broken Demand Zone Explained | 22 October 2026
By Alan Solarsh · 22 October 2026
This gold chart analysis shows 1 broken zone in about 4 minutes.
What the chart shows
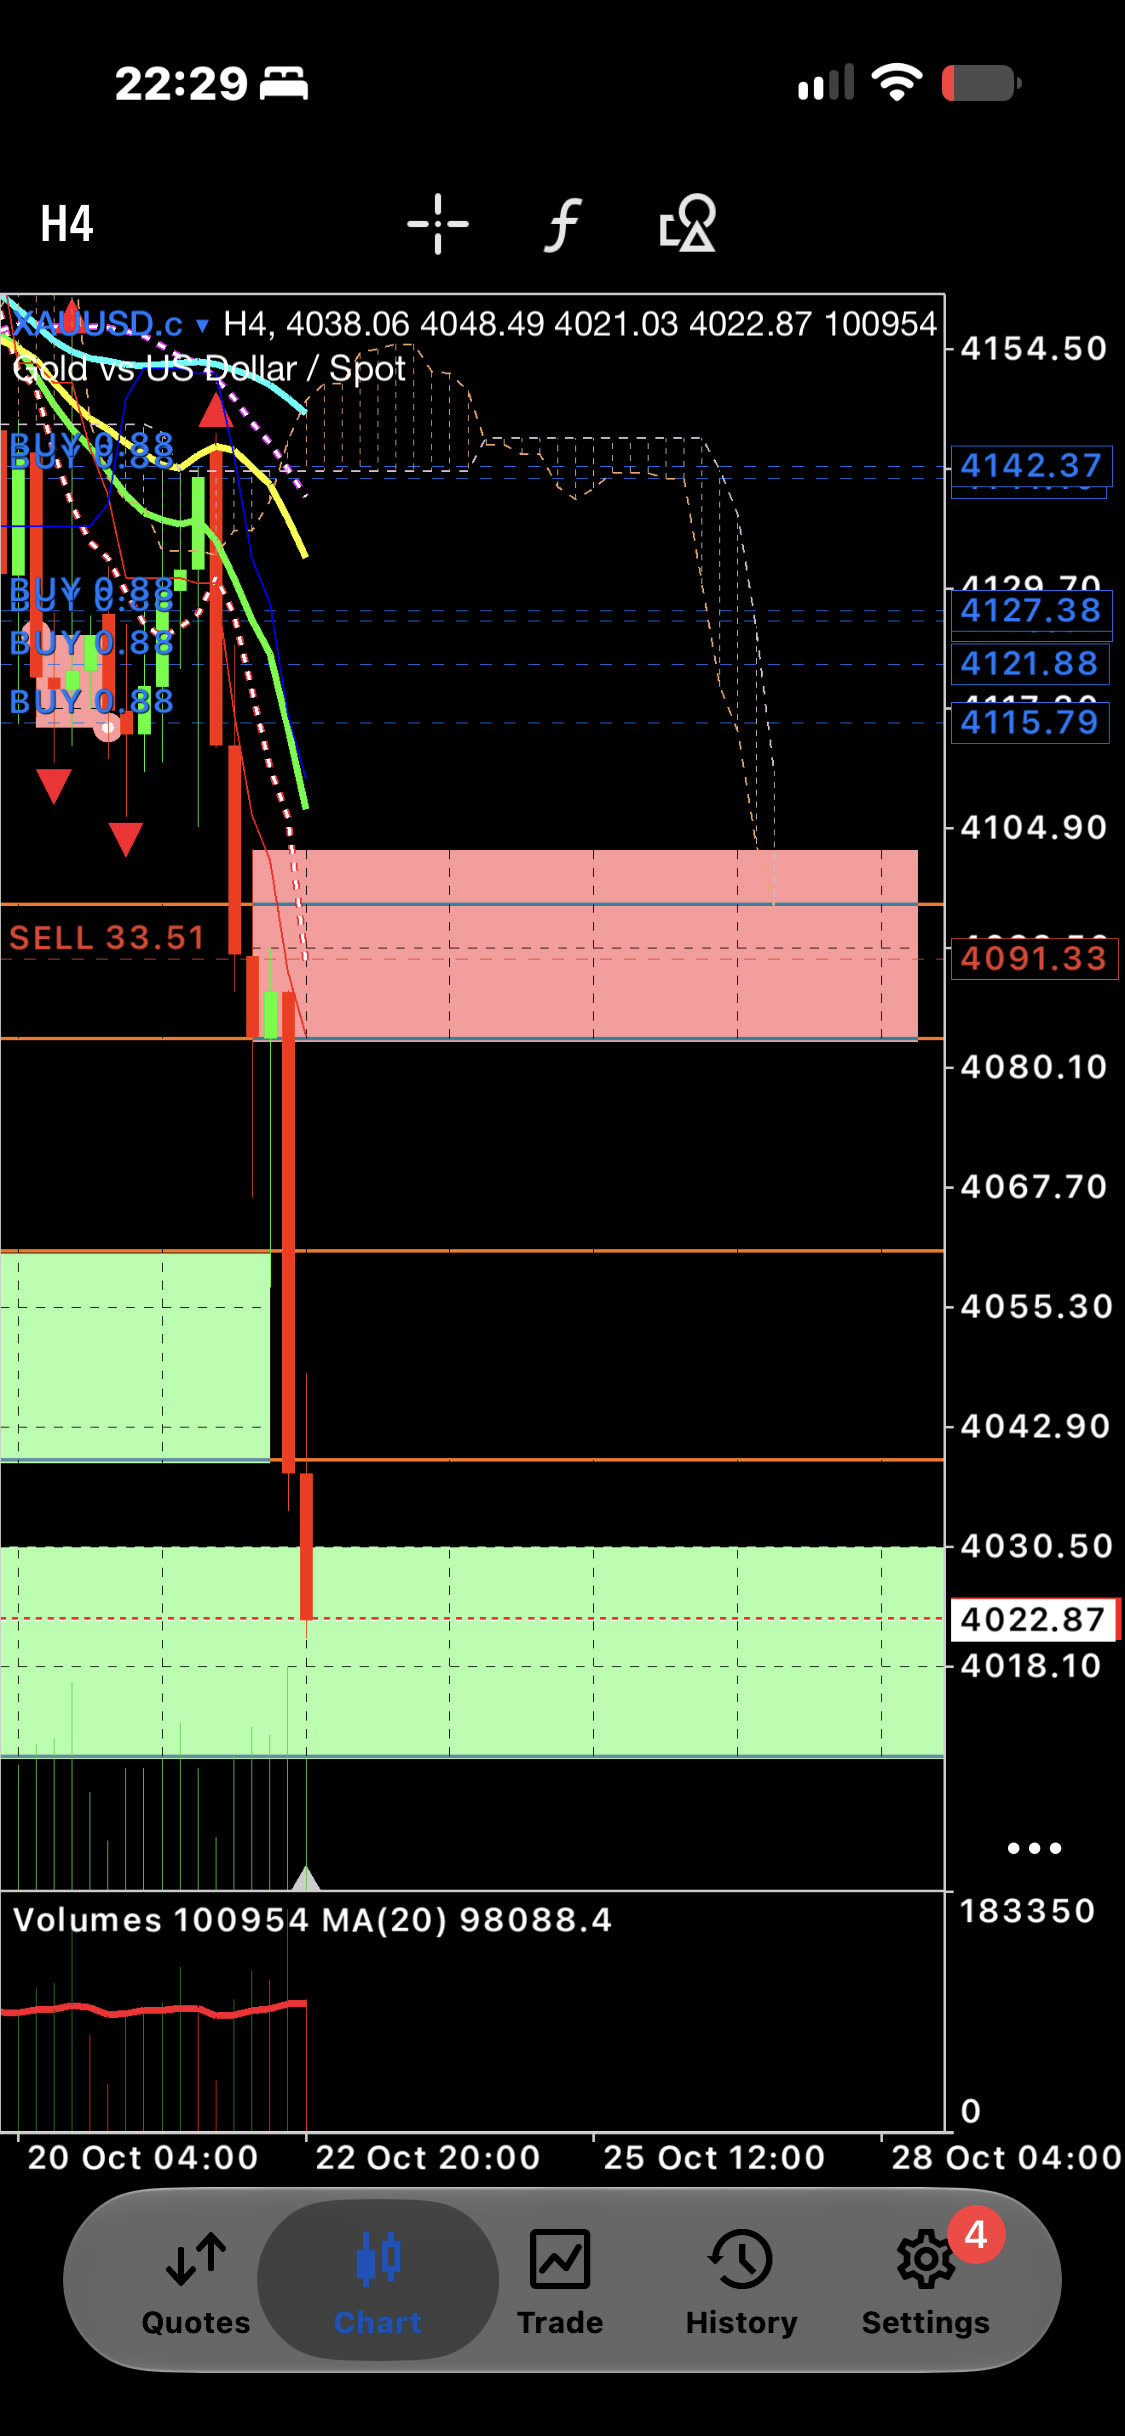
A demand zone is an area where buyers' orders are thought to wait. Alan says it counts as used up once a candle opens below it. He then draws orange lines to mark where that old zone sat.
Marking used-up zones keeps your chart tidy and your decisions calmer. A quick daily check fits easily around a day job.
Key points from the video
- A demand zone is an area where buyers' orders are thought to wait. Alan says it counts as used up once a candle opens below it. He then draws orange lines to mark where that old zone sat.
- Marking used-up zones keeps your chart tidy and your decisions calmer. A quick daily check fits easily around a day job.
Alan's notes for the day
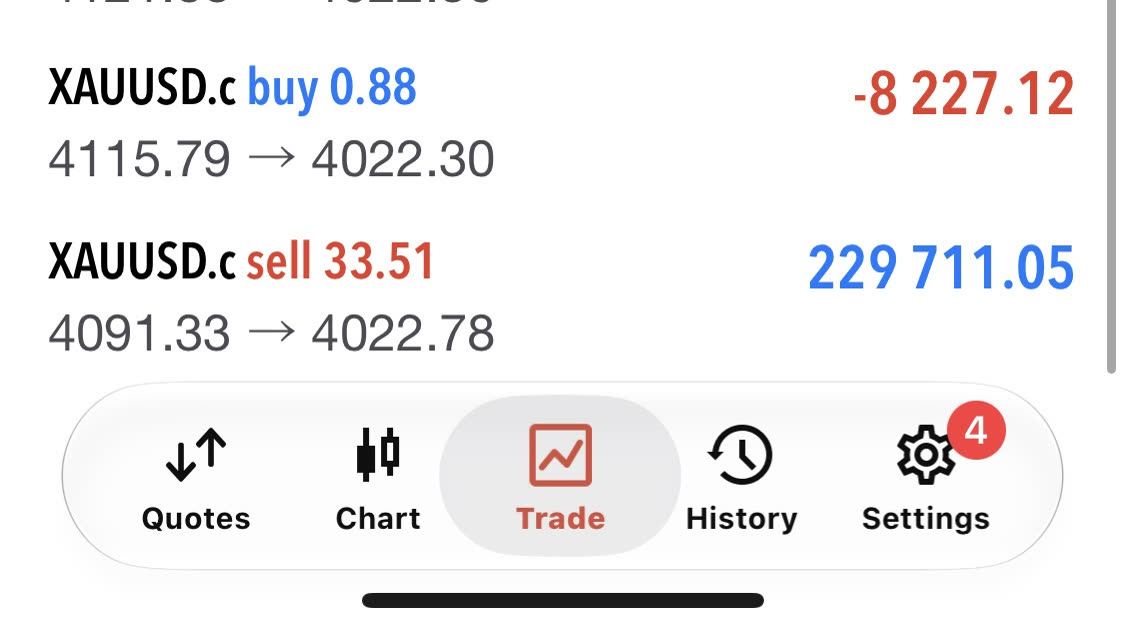
I’m going to be really happy to close it! Hopefully at $3500
If gold drips to $3500 my 33 lot trade will be $19815 in profit!
For those that understand hedging this is amazing
The Learn to Read a Forex Chart course teaches this step by step. You can start free and learn at your own pace.
Learn to read a chart, start freeSee the robotQuestions about this chart
What does this chart analysis show?
A demand zone is an area where buyers' orders are thought to wait. Alan says it counts as used up once a candle opens below it. He then draws orange lines to mark where that old zone sat.
Is this a trading signal?
No. It is education from Alan's own chart. It is not advice and it is not a signal. Forex trading carries risk.
How can I learn to read a chart myself?
Start with the free Learn To Read A Forex Chart course, linked on this page.
Read next
- Learn To Read A Forex Chart, the free course
- All trade analysis videos by Alan Solarsh
- The previous day's chart analysis
- Forex education articles
- See the Forex Robots
Forex trading carries risk. This is education from my own chart, not advice or a signal.
